Mean and median are two common measures of central tendency used in statistics. Understanding the difference between them is crucial for interpreting data accurately. While both offer insights into the “middle” value of a dataset, they do it in different ways, making each suitable for specific situations. Choosing the right measure can drastically impact the interpretation of data and subsequently, decision-making.
So, what exactly sets mean and median apart? The mean, often referred to as the average, is calculated by summing all values in a dataset and dividing by the total number of values. The median, on the other hand, is the middle value when the data is arranged in ascending order.
If the dataset has an odd number of values, the median is simply the middle value. For an even number of values, the median is the average of the two middle values. This inherent difference in calculation makes the median more resistant to outliers, unlike the mean which can be significantly skewed by extreme values.
When to Use Mean vs. Median: A Practical Guide
Choosing between mean and median depends on the nature of your data and the insights you seek. For datasets with a symmetrical distribution and no significant outliers, the mean and median will be close, and either can be used effectively. However, in the presence of outliers or skewed distributions, the median often provides a more representative measure of central tendency. Let’s explore some practical examples.
-
Salaries: When analyzing salaries, the median is usually preferred because a few extremely high salaries can inflate the mean, providing a misleading picture of typical earnings. The median salary offers a better understanding of the “middle” earner’s income.
-
House Prices: Similar to salaries, house prices can be skewed by a small number of very expensive properties. Using the median house price offers a more accurate representation of the typical market value.
-
Test Scores: In educational settings, the mean is commonly used to calculate average test scores, assuming a relatively symmetrical distribution of scores. However, if a few students perform exceptionally poorly or exceptionally well, the median might be a better indicator of overall class performance.
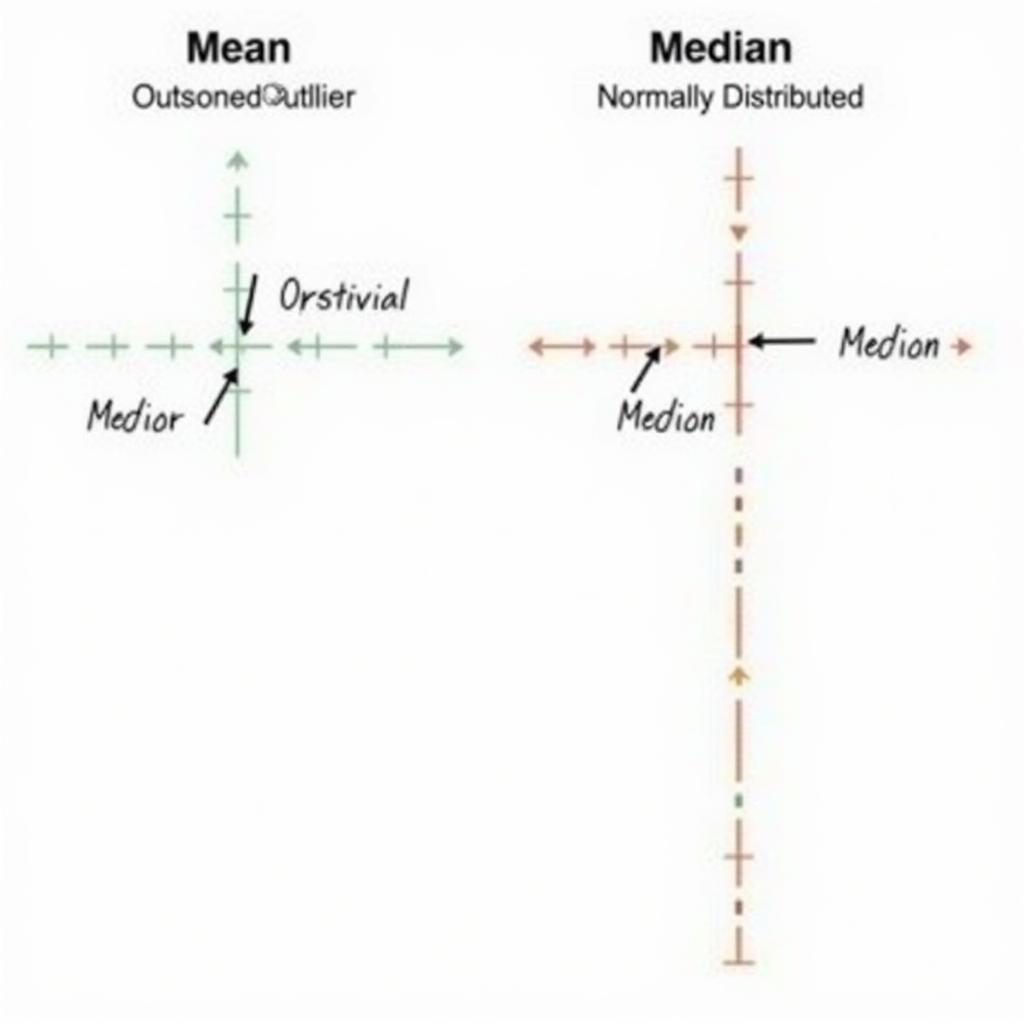
 So sánh Mean và Median
-
Sports Statistics: In sports, the mean is often used for statistics like batting average or points per game. While outliers can occur, they are often part of the narrative and considered relevant to the overall performance evaluation.
-
Scientific Measurements: In scientific studies, the choice between mean and median depends on the type of measurement and the potential presence of errors or extreme values. For measurements prone to errors, the median may be preferred for its robustness.
Calculating Mean vs. Median: Examples and Formulas
Let’s look at some numerical examples to illustrate how to calculate mean and median:
Dataset 1: 2, 4, 6, 8, 10
- Mean: (2+4+6+8+10)/5 = 6
- Median: 6 (the middle value)
Dataset 2: 1, 3, 5, 7, 9, 11
- Mean: (1+3+5+7+9+11)/6 = 6
- Median: (5+7)/2 = 6 (average of the two middle values)
Dataset 3: 2, 5, 7, 12, 50
- Mean: (2+5+7+12+50)/5 = 15.2
- Median: 7
In Dataset 3, the outlier (50) significantly increases the mean, while the median remains closer to the central tendency of the data. This highlights the median’s resistance to outliers. For a deeper understanding of the relationship between mean and average, you can refer to our article on mean vs average formula.
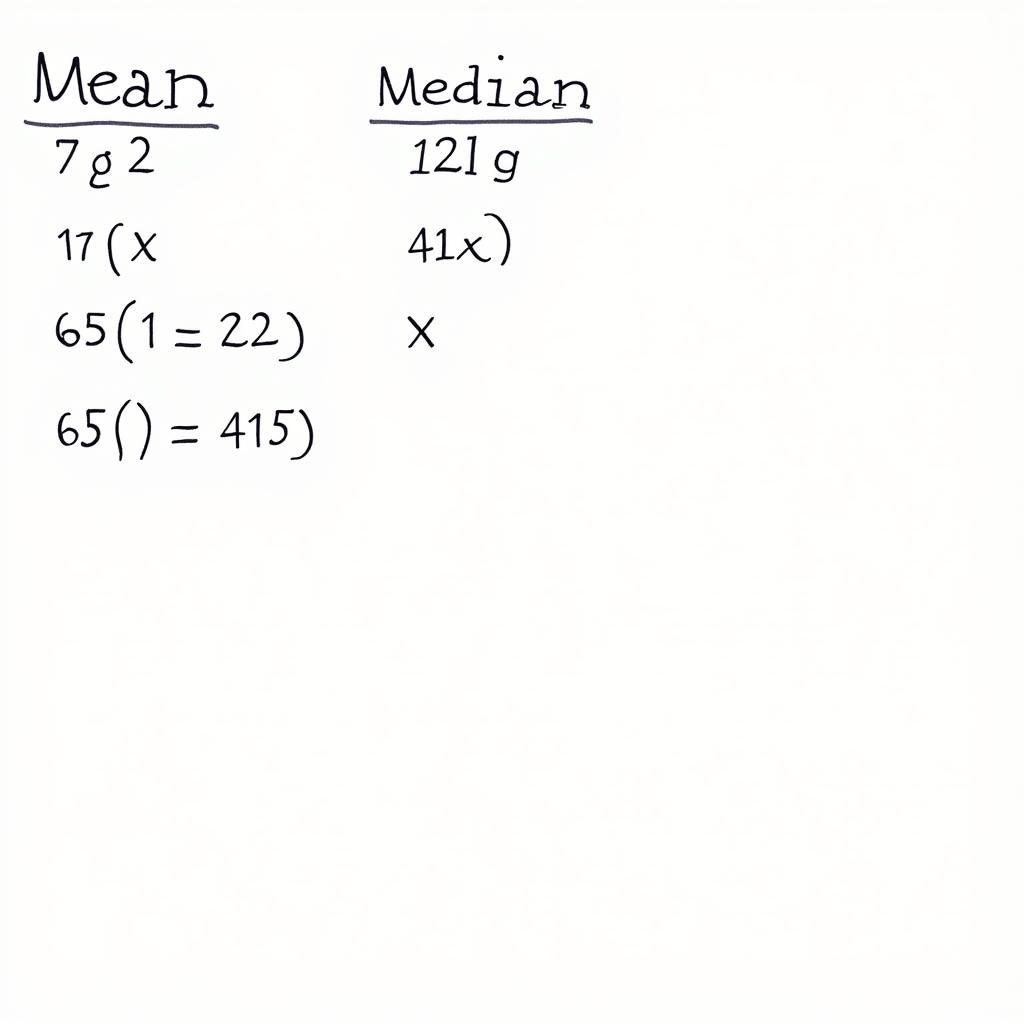
 Công thức tính Mean và Median
Delving Deeper: K-Means vs K-Medians
The concepts of mean and median extend to more complex statistical methods, such as clustering algorithms. One common example is the difference between k-means and k-medians clustering. While k-means uses the mean to determine cluster centers, k-medians uses the median. This distinction makes k-medians less sensitive to outliers, similar to the robustness of the median itself. For further exploration of this topic, you can visit our dedicated article on k means vs k medians.
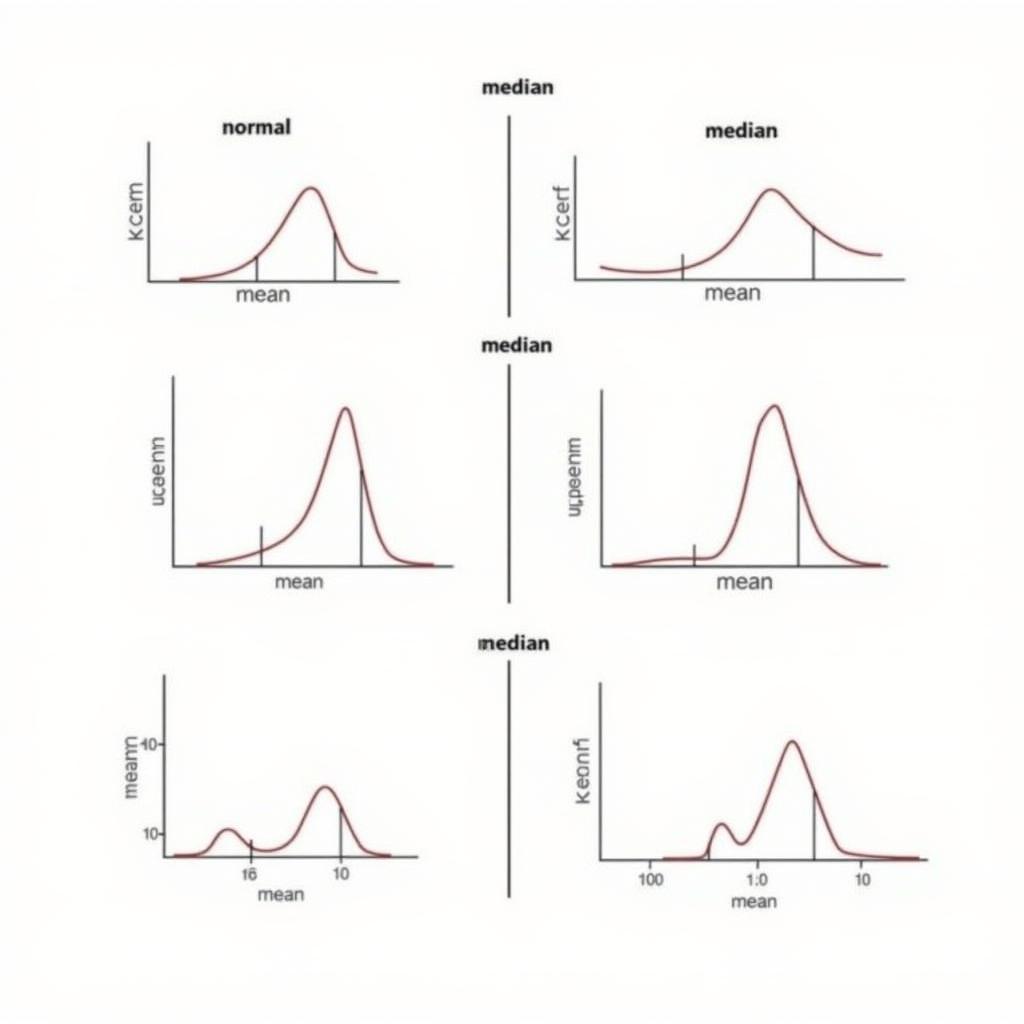
 Biểu đồ phân bố Mean và Median
Conclusion: Choosing the Right Measure
Understanding the difference between mean and median is fundamental for accurate data analysis. Choosing the right measure depends on the context and the characteristics of your data. While the mean is suitable for symmetrical distributions without significant outliers, the median is more robust in the presence of outliers or skewed data. By carefully considering these factors, you can gain more meaningful insights from your data and make informed decisions.
FAQs
- When is the median a better measure of central tendency than the mean?
- How does the presence of outliers affect the mean and median?
- Can the mean and median be the same value?
- What are some real-world examples where using the median is more appropriate?
- How can I calculate the median for a dataset with an even number of values?
- What is the relationship between mean, median, and mode?
- Why is understanding mean vs. median important for data analysis?
Mô tả các tình huống thường gặp câu hỏi.
Người dùng thường thắc mắc về cách chọn giữa mean và median khi phân tích dữ liệu, đặc biệt khi có outlier. Họ cũng muốn biết cách tính toán và ứng dụng thực tế của hai đại lượng này.
Gợi ý các câu hỏi khác, bài viết khác có trong web.
Bạn có thể tìm hiểu thêm về chủ đề phân tích dữ liệu thống kê trên trang web của chúng tôi. Hãy xem các bài viết về độ lệch chuẩn, phân phối chuẩn, và các phương pháp thống kê khác.