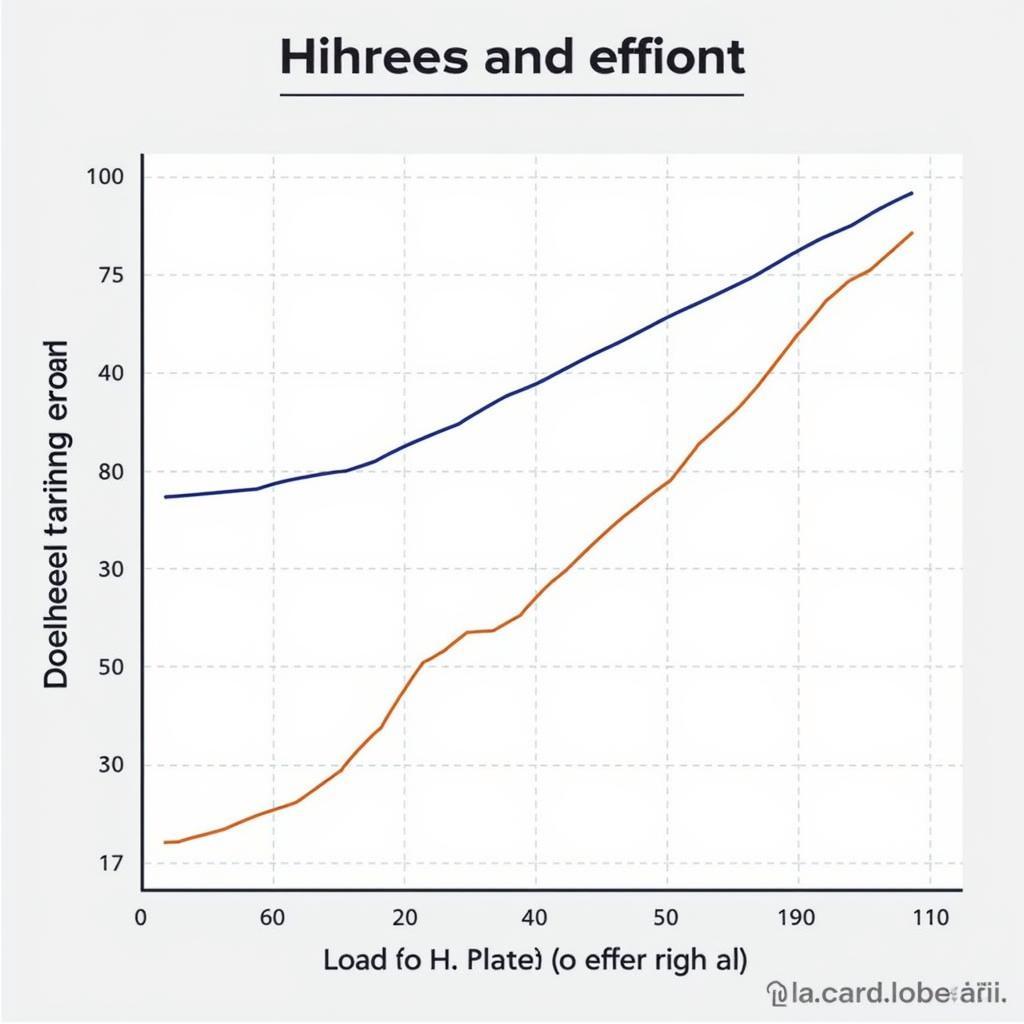
The Load Vs Effort Graph is a crucial tool for understanding player performance and managing training loads in football. It visually represents the relationship between the physical demands placed on a player (load) and the effort they exert in response. This graph helps coaches and sports scientists optimize training, prevent injuries, and maximize player output on the match day.
What is a Load vs Effort Graph?
The load vs effort graph plots a player’s training load against their perceived exertion. Training load is quantifiable through various metrics like distance covered, high-speed running, and accelerations, often collected through GPS tracking. Perceived exertion is subjective, measured through scales like the Borg Rating of Perceived Exertion (RPE), where players rate their effort level. By analyzing the relationship between these two variables, we can gain valuable insights into a player’s physical condition and training response.
After this introductory paragraph, let’s explore the applications of this tool. plants vs zombies garden warfare 2 player count
Interpreting the Load vs Effort Graph
A well-balanced load vs effort graph indicates optimal training. Ideally, increasing load should correlate with increased perceived exertion. Deviations from this norm can signal potential issues. For instance, high load with low effort might suggest fatigue or lack of motivation, while low load with high effort could indicate overtraining or illness. Understanding these variations allows for personalized training adjustments.
High Load, Low Effort: Signs of Fatigue?
When a player’s training load is high but their perceived effort is low, it often signals fatigue. This could be due to accumulated training stress, inadequate recovery, or even underlying health issues. Addressing this imbalance is crucial to prevent further performance decline and potential injuries.
Low Load, High Effort: Overtraining or Illness?
Conversely, a low training load coupled with high perceived exertion may indicate overtraining or illness. The player’s body might be struggling to cope with even light training demands, resulting in a heightened perception of effort. In such cases, rest and recovery are paramount.
 Biểu đồ Load vs Effort thể hiện tập quá sức
Practical Applications of the Load vs Effort Graph
The load vs effort graph is an invaluable tool for coaches and sports scientists. It informs training periodization, allowing for strategic adjustments in training intensity and volume throughout the season. It also helps identify players at risk of injury or overtraining, enabling proactive intervention.
- Individualized Training Programs: The graph allows for the creation of tailored training plans, ensuring each player is working at the appropriate intensity level.
- Injury Prevention: By monitoring the load vs effort relationship, coaches can identify early warning signs of fatigue and overtraining, mitigating the risk of injuries.
- Performance Optimization: Understanding how players respond to different training loads allows for adjustments that maximize their performance on the match day.
“The load vs. effort graph is essential for managing player workloads effectively. It provides objective data that complements subjective feedback, leading to better training decisions.” – Dr. Nguyễn Văn A, Sports Scientist at the Vietnam Football Federation.
Conclusion
The load vs effort graph is a powerful tool for understanding player performance and optimizing training in football. By analyzing the relationship between load and effort, coaches and sports scientists can make informed decisions that enhance player development, minimize injury risk, and maximize performance on the match day. Utilizing the load vs effort graph is crucial for any team striving for success in the modern game.
FAQ
- What is the Borg Rating of Perceived Exertion (RPE)?
- How is training load measured in football?
- What are the signs of overtraining in football players?
- How can the load vs effort graph help prevent injuries?
- How often should the load vs effort graph be analyzed?
- What are the limitations of the load vs effort graph?
- How can technology enhance the use of the load vs effort graph?
Bạn đang tìm kiếm thêm thông tin về hiệu suất của người chơi? Hãy xem bài viết của chúng tôi về [plants vs zombies garden warfare 2 player count](https://truyenthongbongda.com/plants vs zombies-garden-warfare-2-player-count/).
Chúng tôi cũng có các bài viết về các chủ đề khác như chiến thuật bóng đá, dinh dưỡng cho vận động viên và tâm lý thể thao. Hãy khám phá trang web của chúng tôi để tìm hiểu thêm.
Khi cần hỗ trợ hãy liên hệ Số Điện Thoại: 02838172459, Email: [email protected] Hoặc đến địa chỉ: 596 Đ. Hậu Giang, P.12, Quận 6, Hồ Chí Minh 70000, Việt Nam. Chúng tôi có đội ngũ chăm sóc khách hàng 24/7.