Debugging is crucial for efficient web development. Using the Debugger for Chrome extension within VS Code simplifies this process immensely, allowing you to debug your JavaScript code directly within your preferred code editor. This guide will explore how to effectively utilize this powerful tool.
Setting Up the Debugger for Chrome Extension
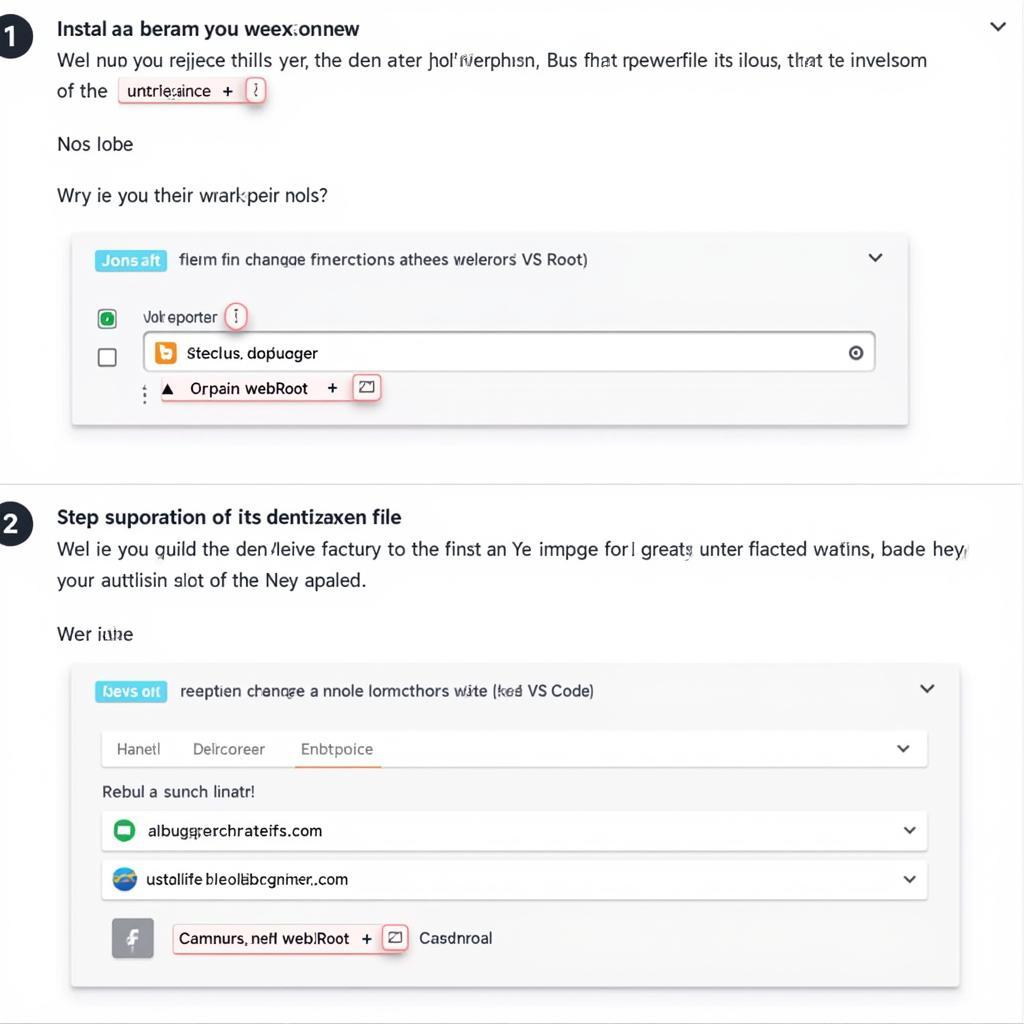
Before you can start debugging, you need to install the “Debugger for Chrome” extension from the VS Code Marketplace. Simply search for it within the extensions panel and click install. After installation, restart VS Code to ensure the extension is properly loaded.
Creating a Launch Configuration
VS Code utilizes launch configurations to define how the debugger should behave. To create one for Chrome, navigate to the “Run and Debug” tab (Ctrl+Shift+D or Cmd+Shift+D) and click on “create a launch.json file”. Choose “Chrome” from the environment selection list. This will generate a launch.json file in a .vscode folder at the root of your project.
A basic configuration looks like this:
{
    "version": "0.2.0",
    "configurations": [
        {
            "type": "chrome",
            "request": "launch",
            "name": "Launch Chrome against localhost",
            "url": "http://localhost:8080",
            "webRoot": "${workspaceFolder}"
        }
    ]
}
The "url" property specifies the address where your application is running. "webRoot" maps the URL to your project’s file system.
 Thiết lập Debugger for Chrome trong VS Code
Setting Breakpoints and Starting a Debugging Session
Once your launch configuration is set, open the JavaScript file you wish to debug. Click in the gutter next to the line numbers to set breakpoints. These breakpoints tell the debugger where to pause execution. Now, start debugging by selecting your configuration from the dropdown in the “Run and Debug” tab and clicking the play button. Chrome will launch and navigate to the specified URL. When the execution reaches a breakpoint, the debugger will pause, allowing you to inspect variables, step through the code, and evaluate expressions.
Utilizing Debugger Features
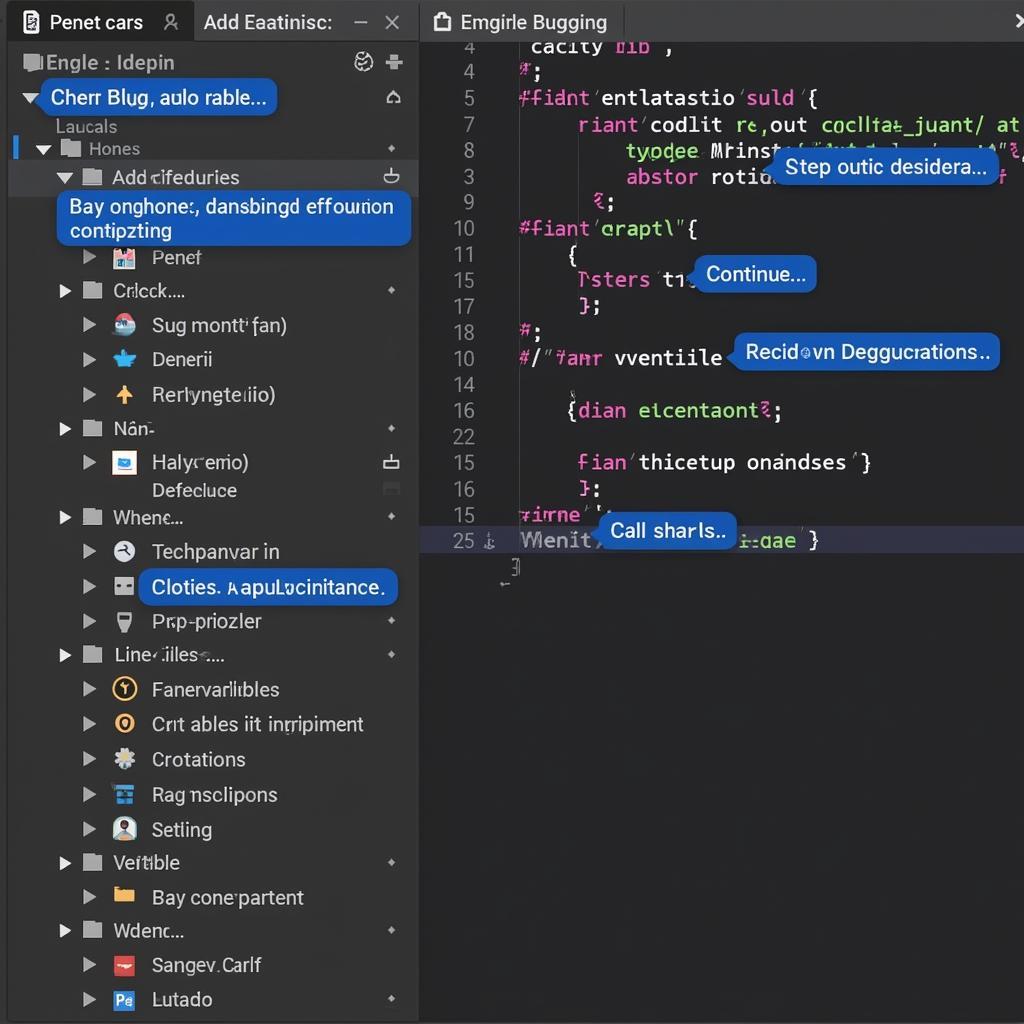
The Debugger for Chrome offers a variety of features:
- Step Over (F10): Executes the current line and moves to the next.
- Step Into (F11): Steps into a function call.
- Step Out (Shift+F11): Steps out of the current function.
- Continue (F5): Resumes execution until the next breakpoint or the end of the script.
- Variables: Inspect the values of variables in the current scope.
- Watch: Monitor specific expressions.
- Call Stack: View the sequence of function calls.
 Sử dụng các tính năng của Debugger for Chrome
Advanced Debugging Techniques
For more complex scenarios:
- Conditional Breakpoints: Configure breakpoints to pause only when certain conditions are met.
- Logpoints: Output messages to the console without stopping execution.
- DOM Breakpoints: Trigger breakpoints when specific DOM elements are modified.
Example: Debugging a Simple Function
Let’s say you have a function:
function add(a, b) {
  let sum = a + b;
  return sum;
}
Set a breakpoint at let sum = a + b;. Start debugging and call the add function. The debugger will pause at the breakpoint. You can now inspect the values of a, b, and sum.
Conclusion
How To Use Debugger For Chrome In Vs Code effectively has been discussed in this article. By mastering the Debugger for Chrome extension, you can significantly improve your debugging workflow, catch errors early, and build more robust web applications. The ability to debug directly within VS Code streamlines the development process and empowers you to create high-quality code efficiently.
FAQ
- How do I install the Debugger for Chrome extension?
- What is a launch configuration in VS Code?
- How do I set breakpoints?
- What are the different stepping options available in the debugger?
- How can I inspect variable values during debugging?
- What are conditional breakpoints and how do I use them?
- What are the benefits of using the Debugger for Chrome extension in VS Code?
Khi cần hỗ trợ hãy liên hệ Số Điện Thoại: 02838172459, Email: [email protected] Hoặc đến địa chỉ: 596 Đ. Hậu Giang, P.12, Quận 6, Hồ Chí Minh 70000, Việt Nam. Chúng tôi có đội ngũ chăm sóc khách hàng 24/7.